 [Example home page]
 Displaying the fuzzy result value at a point
 Other functions: Data export
In order to display the fuzzy result values along a section, the user has to
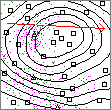
select the section in the 2-dimensional display of the kriging window.
This can be done by
clicking at the starting point and dragging a line with the left mouse button
depressed. Upon releasing the mouse button the section is marked with
an orange arrow.

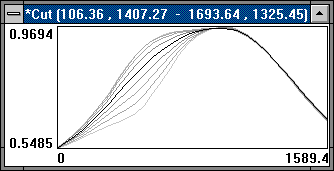
The following window appears on selecting
"Cut (reduce to 0d/1d)" (from the submenu "Arrow") or
just by typing "C" (the same key as for the point display):

The black curve shows the most possible values. The lightest
grey curves (the lowest and highest ones) show the lowest and highest
possible values.
The other grey curves are for the other level-cuts,
which are defined in the cuts-section
of the input data file.
The beginning and ending points' coordinates are shown in the title bar.