 [Example home page]
 Choosing a display type for this application
 Displaying the fuzzy result values along a section
In order to show the fuzzy result value (represented by a
fuzzy number) at
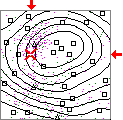
a point, the user has to select the point
in the 2-dimensional display of the kriging window. This can be done by
selecting the desired point with a mouse click.
The point is then marked with an orange cross.

The following window appears on selecting
"Cut (reduce to 0d/1d)" (from the submenu "Arrow") or
just by typing "C":

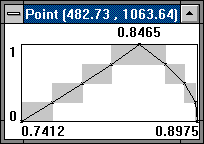
Here you can see the fuzzy number at the point (the coordinates are shown in
the title bar). The fuzzy value in this example can be interpreted as follows:
The most possible value is 0.8465, but values
everywhere in the range from 0.7412 to 0.8975 are possible. The
degree of the possibility decreases from the most possible value to the sides
as shown by the displayed membership function.
The complete membership function is not calculated.
The heights for which values are calculated have been specified in
the input file (see the cuts-section).
In our example we specified CUTS 1.0 0.75 0.5 0.25 0.0.
The black line connecting the small marked points is a simplified
linear interpolation. The true one could run anywhere
through the grey boxes. If you want to obtain a higher precision, you must
specify in the cuts-section more levels between 1.0 and 0.0.
 Displaying the fuzzy result values along a section