 Displaying the fuzzy result value at a point
 [Example home page]
 Kriging window used for 2-dimensional display Displaying the fuzzy result value at a point
Two types of display of the results have been shown on the two last pages.
The features described on the previous page can be used to choose a display
type that shows all the important details in just one picture.
In our example we want to be cautious and take the known
possible deviation and inexactness into consideration (of course, because
when judging about a waste disposal site one should be on the safe side).
The picture must contain at least the following information:
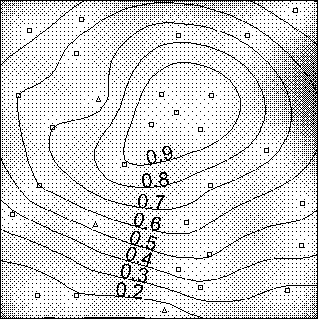
One should fix a membership value that is assumed to be high enough.
In our example we choose 0.8.
Then we look for an area where the values are greater than this limit.
First of all, we can take the fuzziness into account. Here we took the
lowest possible value (which is in this case the essential part of the
fuzzy result) in order to be on the safe side.
Have a look at the 0.8-isoline in the picture above and the way it runs
around the fuzzy point on the left side.
But one must be aware that the fuzzy result is also only an estimation
(except the locations where fuzzy or crisp input data is given).
The advantage of the (fuzzy) kriging method that the
variance of the resulting data can be calculated can now be used:
In the picture above we should especially not go to the very right side of
the region with the lowest possible values 0.8, because we can see
a relatively high estimation variance there (due to the lack of enough input
data points in this area).
On the next pages we can see the result with more detail and explore some other functions of the program with respect to data export.
Displaying the fuzzy result value at a point