FUZZEKS [to Index]
Tour: Kriging window used for 2-dimensional display
 [Example home page]
 A first glance at the result
 Choosing a display type for this application
 Kriging Basics / Theoretical concepts explains
about the fuzzy kriging method in detail.
This page roughly describes the use of fuzzy kriging with FUZZEKS. If you
are not familiar to kriging methods it may be easier to understand these
topics in full detail when reading about
Kriging Basics / Theoretical concepts first or, if you want
further information about some special topic, have a look at the table of contents
(quite at the end of the table of contents are the corresponding topics).
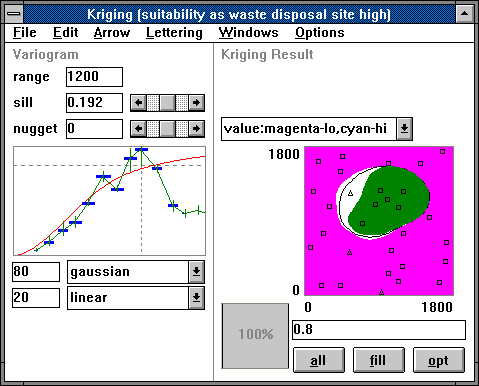
The kriging window contains two items:
On the left side there is a display that contains both the experimental
and the theoretical variogram.
The experimental variogram is shown by the crosses and
serves as statistical basis to find a theoretical variogram.
The theoretical variogram is displayed as red curve and serves as
basis of the kriging process. Its parameters, like type of
the curve and range/sill/nugget-effect must be given by the user.
On the right side there is the kriging result as 2-dimensional graphics.

The variogram
Since the estimations by the kriging procedure are based on the
theoretical variogram (defined by the user), the quality of the kriging
result depends on the quality of the theoretical variogram.
There are several points to take into account when choosing this theoretical
variogram:
- The match with the experimental variogram, which is calculated by using
the input data.
- The kriging result should not contradict the user's possible assumptions
on how the isolines are supposed to run.
- A cross-validation can be done with other programs (using crisp kriging,
but the same theoretical variogram). This procedure leaves out
sequentially any single
point of the input and kriges a value at this location in order to
compare real values with estimated ones.
This option is not part of FUZZEKS at this point of time.
- The kriging variance (which also can be calculated by FUZZEKS)
should be not too high in any area of interest.
Of course, the user should not look at the absolute values with
respect to the kriging variance.
It also must be considered that the calculation of the kriging variance
bases on the theoretical variogram as well as the kriging result itself
(i.e. if the theoretical variogram is wrong the kriging variance can not
be trusted).
There is a large options dialog window that allows to influence the method of
calculating and displaying the experimental and theoretical variogram.
Moreover an ASCII-output of the experimental variogram is possible.
 This is described in more detail in Theoretical
variogram fitting (Function types and parameters)
The result
The result consists of fuzzy values in 2-dimensional space and an estimated
variance of the results also in 2 dimensions.
The above picture shows the result of the parameter aggregation as shown on the
previous page, but the above picture demonstrates another type of display:
The places where values are estimated to be clearly higher than 0.8
(which means that the minimum possible value is greater than 0.8) are
colored green and the places where values are estimated to be
clearly lower than 0.8 (which means that the maximum possible value
is smaller than 0.8) are colored magenta.
The black contour marks the line where the
most possible border of the region with values higher than 0.8 is.
The white space between magenta and green indicates the area where it is not
clear wether the value is higher, equal or lower than 0.8 (i.e.
the minimum possible value is smaller or equal than 0.8 and the maximum
possible value is larger or equal than 0.8).
This is not the only possible way to display the results.
FUZZEKS offers various options:
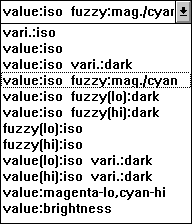
- The type of display. You can select this out of a list of available types:

The element to be displayed is stated left of the colon (":"),
the method to do it on the right.
- vari. means "estimated kriging variance".
value means "by kriging estimated most possible values".
value(lo) means "by kriging estimated minimal values".
fuzzy means "the fuzziness" (i.e. possible deviations to
both sides (the size of the range of the values with possibility
degree larger than 0) ).
fuzzy(lo) means "the possible deviations to the bottom".
- iso means "using isolines".
darkness means "the darker the region is, the higher is the
value".
mag./cyan means "possible deviations to lower/higher values
are displayed by the density of magenta/cyan points".
For magenta-lo,cyan-hi see the example above.
brightness means "brighter regions indicate larger values".
The next page discusses how to find an appropriate type of display for
the example.
Following are settings, which can be influenced via
options dialog windows:
- Isolines: The distance (in value space) and the lettering.
- The resolution of the result (higher resolutions need longer calculation
times but deliver more exact results).
- Whether the variance should be calculated or not (this also uses more
calculation time).
- Result values can also be shown for a single point or a section.
The fuzzy values can be seen in more detail then.
These facilities are shown on two of the next pages.
- An ASCII-output for a given grid is possible too (shown as 3rd next page).
 Choosing a display type for this application
 Kriging Basics / Theoretical concepts explains
about the fuzzy kriging method in detail.
 Theoretical variogram fitting
(Function types and parameters)
 Kriging Basics / Theoretical concepts explains
about the fuzzy kriging method in detail.
 [Example home page]
 A first glance at the result
 Choosing a display type for this application
 Kriging Basics / Theoretical concepts explains
about the fuzzy kriging method in detail.
 This is described in more detail in Theoretical
variogram fitting (Function types and parameters)
 Choosing a display type for this application
 Kriging Basics / Theoretical concepts explains
about the fuzzy kriging method in detail.
 Theoretical variogram fitting
(Function types and parameters)