FUZZEKS [to Index]
2D spatial viewing
Because of the importance of the presentation of the results
in two dimensions, this display is placed directly in the kriging window and
has lots of options for customization.
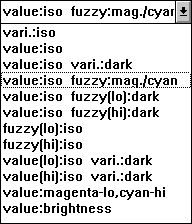
In the kriging window at top of the display of the result there is this
listbox:

A sample picture for each of these options can be seen
here.
In order to find out about all the facilities it is recommended to
try out each of the entries (one at a time) and then interpret the
display with help of the following information:
On the left side of the colon there is the item to display:
- vari.: Variance of the result. This is only calculated when
"Calculate variance" in the options menu is checked.
- value: The most possible values that are estimated by the kriging
procedure. In the case of only crisp input data this is the crisp result.
- value(lo)/(hi): The estimated lowest/highest possible values of the
result (estimated by fuzzy kriging).
- fuzzy(lo)/(hi): The estimated largest deviation to
lower/higher possible values of the result (estimated by fuzzy kriging).
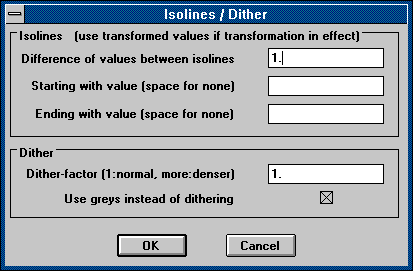
On the right side of the colon there is the display-method, which is
also influenced by the options dialog window
"Options"/"Isolines/Dithering":

- iso: Isolines are used. In order to view the value an isoline
represents, the user can request a lettering of the isolines:
At first, draw with the mouse an orange arrow from the bottom of
the desired lettering to the top (use the mouse as described in
1D spatial viewing (cuts, sections)). Where
this arrow and isolines intersect, an inscription with the value
for the isoline is placed. There is a special "Lettering" menu
with possibilities to add and remove letterings.
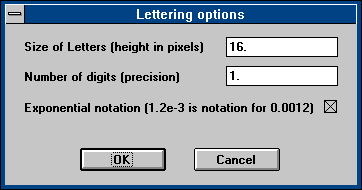
And "Options"/"Lettering"
allows to customize the lettering:

Summary: For isolines one needs
1. to use the "Isolines/Dithering" dialog window,
2. to make letterings directly by the mouse and by the
"Lettering" menu and
3. to check the "Lettering Options" dialog window.
- dark: Greyshades or dithering with black points are used
to display the values; larger values are represented by darker areas.
- mag./cyan: The density of magenta/cyan points is used to
show possible deviations to lower/higher values (with respect to
the fuzziness of the values). This allows to superimpose the most
important information which we get from fuzzy numbers (combined with
isolines for the most possible value).
- magenta-lo,cyan-hi: This option is used in conjunction with
an extra input field. In this field (just below the map) you
enter the value you are interested in.
Then areas where the estimated value is
lower/higher than the given value, are colored magenta/cyan.
- brightness: Greyshades are used to display the values;
larger values are represented by brighter areas.
The marks for the locations of the input data points are left out.
This makes it possible to have
a display with greyshades for the values only, which can be useful
for a quick overview or
for the visualization for the most possible values if you have a program
which uses such a map of grey-shades (e.g. programs that generate
pictures with a stereoscopic effect (e.g. single image stereograms)).
More about display options at these pages:


