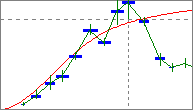

number    of points:          30   (input data points)
shifting  of groups:      123.19   (increase of distance from group to group)
number of >0-groups:          16
number  of 0-groups:           0   (groups without a value-pair (no row))
% overlap of groups:           0   (see variogram options)
max.     to observe:           0   (see variogram options)
theoretical variogram:  range:        1000          (the theoretical
                         sill:         2.8           variogram can also
                       nugget:           0           be displayed as a
                         type:  60.0 % gaussian      column in the table
                         type:  40.0 % linear        as shown below: ytheo)
      xmean      npairs       ytheo       ymean  yfuzzy_min  yfuzzy_max
----------- ----------- ----------- ----------- ----------- -----------
    205.734          14    0.430314    0.358571    0.287143    0.701429
    324.999          25    0.819329      0.6684      0.5172       1.102
    449.098          30     1.26433       0.799    0.594667     1.45167
     567.53          46     1.67493        1.67     1.43761     2.29239
    691.947          38     2.05413     1.92974     1.75974     2.38526
    816.776          45     2.36666     2.65311     2.23533     3.42556
    938.201          44     2.61023     2.64136     2.52023     2.89864
    1055.59          38     2.80243     2.71553        2.19     3.68395
    1180.75          46     2.97655     2.60022     2.23978     3.27804
    1305.72          26     3.13219     2.82038     2.42615     3.74346
     1424.9          24     3.27203     1.04125     0.91625       1.375
    1548.74          29     3.41331     1.32379     1.14966     1.73448
    1672.13          14      3.5524    0.707143        0.66     1.09286
    1783.23           7     3.67709    0.311429        0.26    0.625714
    1925.06           6     3.83605    0.273333    0.273333    0.273333
    2088.99           2     4.01966        0.01        0.01        0.01
This is the same information that can be seen in the
variogram window of the kriging window:
The next pages deal with