FUZZEKS [to Index]
Variogram Options
The kriging window contains the display of
the variogram.
The display of the variogram can be customized:
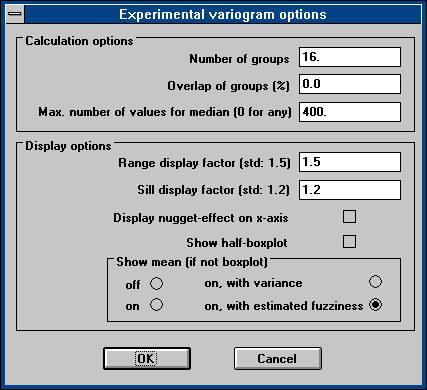
Selecting "Options"/"Variogram" from the kriging window's menu
opens this dialog window:

- Calculation Options
In order to perform the calculation of an experimental variogram,
the pairs of two data points must be put in groups of similar distances.
For half of the squares of the value-differences of these elements in one
group a mean is calculated and displayed as cross of horizontal blue and
vertical green line.
The groups are specified by the number of groups, their overlap
and the maximum distance of two input data points. If the overlap is zero,
the maximum distance is simply subdivided into the specified number of
groups with the same width. If overlap is greater than zero, the groups
are expanded until they overlap the specified percentage.
(If one would like a finer granularity of the experimental variogram,
but the same group size one could double the number of groups and
make them overlap 100%.)
If a non-zero number is specified for the max. number of values for
median, only the specified number of value-pairs is taken
(randomly chosen) in order to calculate the experimental variogram
values for the boxplot. This makes the experimental variogram
calculation much faster if many input data points are available.
This setting does not affect the usual
experimental variogram values (the mean and fuzziness).
- Display options
These options influence the display of both experimental and theoretical
variogram in the kriging window (a recalculation is not nescessary if
only these options are changed):
- The range display factor (x-axis) decides how much more can be
seen than the range from zero to the range. Typically one would
choose 1.5 in order to see 50% more.
The vertical dashed line shows the range.
- The sill display factor (y-axis) decides similarly how much more
can be seen than the range from zero to the sill. Typically one would
choose 1.2 in order to see 20% more.
Remark: The horizontal dashed line shows the sill.
- The checkbox display nugget-effect on x-axis decides if the
y-axis starts at zero or at the value of the nugget-effect.
Typically this is
not checked, in order to see the amount of nugget-effect. If the
nugget-effect is very large (compared to the sill) the vertical
resolution is better with this option checked, but one should be
aware that a large nugget-effect indicates that preconditions for
the use of kriging are possibly not satisfied.
- The checkbox show boxplot enables the display of a boxplot
for the experimental variogram values instead of the mean.
(The boxplot displays the min./max. value, the 25%/75%-quantiles
are diplayed as box and the median is displayed as horizontal line
in the box.)
See also the remarks about the max. number of values for median.
- The show mean (if not boxplot) options decide, how the
experimental variogram values are displayed:
- off: No display at all.
- on: No vertical green line, but the points are connected
by green lines.
- on, with variance: The vertical green line indicates
the amount of variance found in the values taken to calculate
the mean of each single group. This delivers information about
the distribution of values in each group.
- on, with fuzziness: The vertical green line shows the range
of possible values with respect to the fuzziness of the input
data. This is the typical selection. The fuzziness is only
estimated - the true values would give a smaller range (the
true vertical green lines would be shorter).
This option has been selected for the example.
The next pages deal with

