 [Example home page]
 Input data
 Membership functions for preparation of the
aggregation
The first step is to select "Project" / "Load Input File" from the
background window and to specify the name of the input file in the appearing
file requester.
Then the contents of the management window changes to:

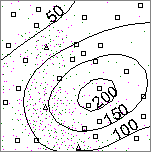
By clicking on the "kriging window" icon - bottom right of each of the management window's items - the user opens a so-called "kriging window". A detailed examination of these windows follows later in this example (at the discussion of the results of the aggregation). The kriging windows provide a two-dimensional display of the input data, shown in the following graphics.
These graphics use isolines to display the most possible value
(see Kriging Basics / Theoretical concepts and
2D spatial viewing).
The density of cyan and magenta points indicates the fuzziness
of the data: Darker regions have a larger bandwith of values. The small
squares show where crisp data points are located, the triangles show
the location of the fuzzy input data points (and small
"u"s indicate undefined values (positions where other parameters
have a value or where an "undef" has been assigned in the input
data file)).
Compare the graphics to the input file shown on the
previous page.
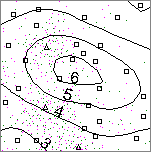 WATER_TABLE_DEPTH (m)
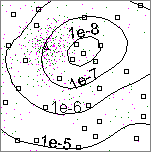 HYDRAULIC_CONDUCTIVITY (m/s)
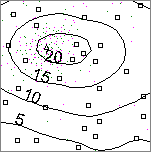 CLAY_CONTENT (%)
 CL_CONCENTRATION (mg/l)
 Membership functions for preparation of the aggregation
 Load Input File / FDF-inputfile-format
 Background window:
Quick reference / Window description
 Management window: Overview
 Management window:
Quick reference / Window description